
You've implemented the custom score. What should you monitor from now on?
- June 23, 2026
- Credit Decisions
The model has gone into production. The work of monitoring its performance is just beginning.
The implementation of a custom scoring model is often treated as a project with a beginning, middle, and end: diagnosis, development, validation, integration, and production. Once the model is up and running, the project seems complete.
That’s not the case. Once the model goes into production, a different phase begins: continuous monitoring. Without it, a model that performs well today may lose accuracy within a few months without anyone noticing until the delinquency rate or approval rate has already shifted.
This article covers the four metrics that need to be monitored once a custom score goes live: KS over time, coverage rate by score band, approval distribution, and score stability—measured by PSI—over time. If your operation already has a model in production, this is your monitoring roadmap. If you are evaluating implementation, this article explains what to expect after signing the contract.
1. The Four Dimensions of Monitoring
Each of the following four dimensions measures a different aspect of the model's health. None of them is a substitute for the others. Together, they form the minimum monitoring dashboard for a production score.
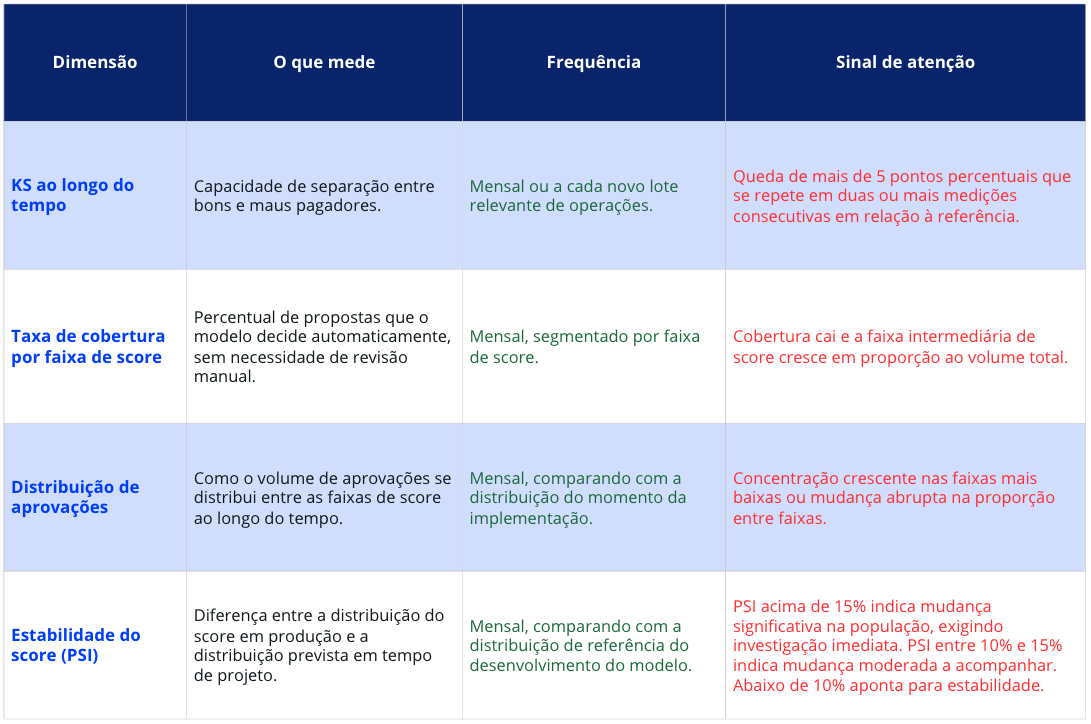
Why are four dimensions necessary, rather than just one?
KS on its own may appear stable while the coverage rate quietly declines. Stable coverage may mask a shift in the distribution of approvals toward higher-risk segments. The PSI, in turn, detects changes in the population entering the model before those changes translate into a decline in KS or coverage.
Monitoring only one dimension creates a blind spot in the other three. Comprehensive monitoring requires all four dimensions to be considered together, even if at different frequencies.
2. KS Over Time: The Benchmark Metric
What to Look For
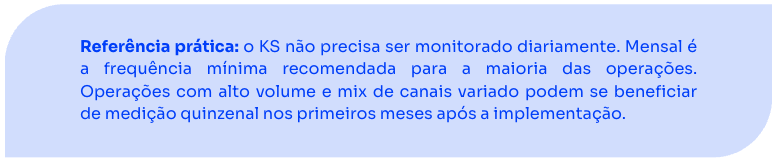
The KS measured at the time of implementation is the starting point, not a fixed value. The key question in ongoing monitoring is not just what the current KS is, but how it compares to the baseline measurement and what the trend has been over the past few months.
A single reading that is lower than expected may be statistical noise, especially in operations with low monthly volume. A sustained downward trend over three or four consecutive readings is a sign that warrants further investigation.
How to Segment the Measurement
The aggregate KS for the entire portfolio masks significant variations. Segmenting the data by origination channel, market, and ticket size reveals whether the decline—if any—is concentrated in a specific segment or is widespread.
A localized decline points to a specific cause, such as a change in the profile of a particular channel. A widespread decline points to a more structural cause, related to the general behavior of the market or niche.
3. Coverage Rate by Score Range
What this metric reveals
The coverage rate measures the percentage of claims that the model resolves automatically, without the need for manual review. It is the metric that directly links the model's performance to the back-office's operating costs.
When coverage drops, the intermediate score range—where the model lacks sufficient confidence to make a decision on its own—is expanding. This means more volume is being routed to manual review, which is exactly the pattern this series has already documented in detail in the context of declining KS.
How to follow along
Segmentation by score range is essential here as well. Aggregate coverage may remain stable while a specific range—usually the middle one—is consistently losing coverage. Monitoring the trends in each range separately helps identify the problem before it visibly affects the aggregate figure.
4. Distribution of Approvals
Why distribution matters just as much as the rate
Two transactions may have the same overall approval rate but completely different risk profiles within the approved portfolio. The distribution of approvals across score ranges shows in which ranges, within the set of approved applications, the volume is concentrated.
If the distribution is shifting over time toward lower score ranges—even with a stable overall approval rate—the portfolio is taking on more risk than it did at the time of implementation. This trend typically precedes a rise in delinquency by a few weeks or months.
What to Compare
The distribution for the current month needs to be compared with the distribution at the time of implementation, not just with that of the previous month. Gradual, small changes from month to month may go unnoticed in short-term comparisons, but become evident when compared with the starting point.
5. Early signs: what appears before the formal metric
The three dimensions mentioned above depend on direct performance metrics: the distinction between good and bad payers, coverage, and the distribution of approvals. The PSI (Population Stability Index) measures something different yet complementary: the extent to which the population of applicants entering the model today resembles the population used to develop the model.
How the PSI Works
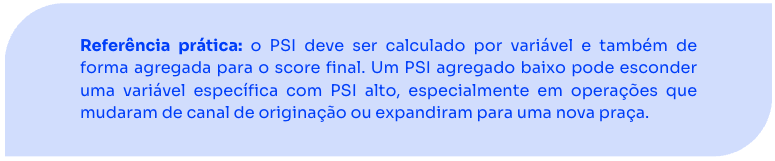
The PSI compares the distribution of scores in production with the predicted score distribution at the time of project design, segmented by brackets. The greater the difference between the two distributions, the higher the PSI. Low values indicate that the current population behaves similarly to the development population. High values indicate that the profile of those applying for credit today has changed from the model’s original profile.
Why does this matter before the other metrics change?
A change in the population may not immediately impact the KS, but it is often the first sign that something in the channel mix, the customer acquisition profile, or market behavior has changed. The PSI captures this trend before it results in a decline in coverage or a concentration of approvals in higher-risk segments.
How to Interpret the PSI
The most commonly used market benchmark for PSI consists of three bands:
- PSI below 10%: Stable population; no action required.
- PSI between 10% and 15%: a moderate change in the population; closer monitoring is recommended for subsequent measurements.
- PSI above 15%: a significant change in the population; immediate investigation of the cause is recommended.
6. What to Do When a Warning Sign Appears
Identifying a sign of a decline is the beginning of the process, not the end. The next step depends on where the cause lies.
If the decline is concentrated in a specific channel, market, or segment, the likely cause is isolated and related to that specific area. If the decline is widespread across all segments, the likely cause is more structural. In both cases, the technical diagnosis of the model is the step that determines the correct course of action, and it is precisely this diagnosis that falls outside the scope of monitoring and within the scope of a dedicated analysis.
4kst provides the Customized Credit Score, the model’s KS, technical documentation detailing the relevance of the variables, and an initial assessment of the operation. When monitoring indicates a downward trend—whether in KS, coverage, approval distribution, or PSI—a discussion with the technical team is the best way to determine whether the case requires an update, an adjustment to the variables, or a more in-depth analysis of what has changed in the operation.
Conclusion
A customized scoring model in production is not a system that runs on its own indefinitely. It is a model that requires structured monitoring to ensure that its performance in the first month is maintained through the twelfth month.
KS, coverage ratio, approval distribution, and score stability as measured by the PSI constitute the minimum monitoring framework. None of these four dimensions replaces the others, and it is their combination that enables action to be taken before a decline in performance manifests as delinquency or a loss of revenue.
If your operation already has a model in production and this monitoring process hasn't yet been set up, or if you're evaluating implementation and want to understand how this process works in practice, the next step is to speak with the 4kst technical team.

About 4kst
4kst is a science-based Brazilian DeepTech company that emerged from the AI Research Center at PUCPR. Our technology is used by fintechs, digital banks, credit unions, and retailers with in-house financial operations to transform data into smarter, faster, and more profitable credit decisions.
Related articles

Stay ahead
of the competition
Optimize your strategic decisions with the most assertive
forecasts on the market.
-
 LGPD compliance
 -
BCB Resolution 85/2021
-
ISO/ISE 27001:2022 certification